Mutual Funds Statistics & Facts
Mutual funds are financial vehicles that pool investors’ money and put them in different kinds of securities. The advantages of mutual funds include higher diversification and lower cost of investment, professional management, flexibility, access to global financial instruments and markets, etc. This, however, comes at the price of hefty fees and less control over your investments. These mutual funds statistics show that the industry has been thriving, especially in the US, where plenty of investors favor them over bank accounts due to their potential for returns. So, read on to learn more about mutual funds, along with the most relevant trends for the new decade.
Mutual Funds Statistics (Editor’s Choice)
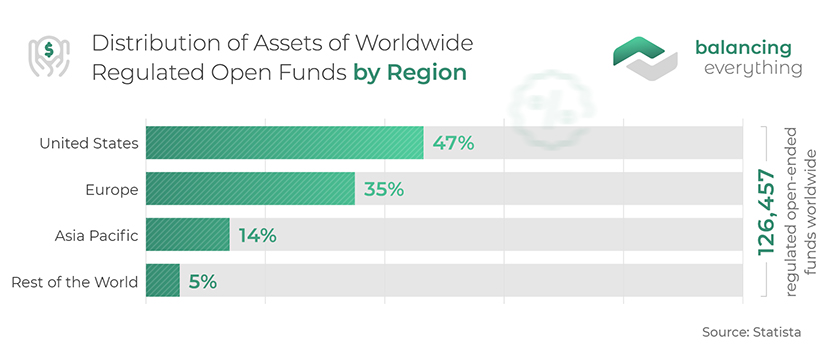
- 47% of the assets of regulated open funds worldwide in 2020 were concentrated in the US. (Statista)
- The total net assets of US-registered mutual funds in 2020 were $23.9 trillion. (Statista)
- BlackRock Funds is the largest mutual fund management company in the world by AUM. (MutualFundDirrectory)
- The largest mutual fund in the world by AUM is the Vanguard 500 Index Fund; Admiral. (Investopedia)
- Luxembourg is the country with the second-largest mutual fund industry. (Statista)
- 47% of all mutual fund assets in the US are held in retirement accounts. (ICI)
Mutual Fund Industry Trends
1. There were over 177k regulated open-end funds worldwide in 2021.
Open-end or open-ended funds refer to a collective investment scheme that can issue and redeem shares at any time. By contrast, a closed-end fund issues a fixed number of shares which are then tradable among investors. As of the end of 2021, there were 177,304 regulated open-ended funds worldwide. Open-end funds include mutual funds, exchange-traded funds, and institutional funds.
(Statista)
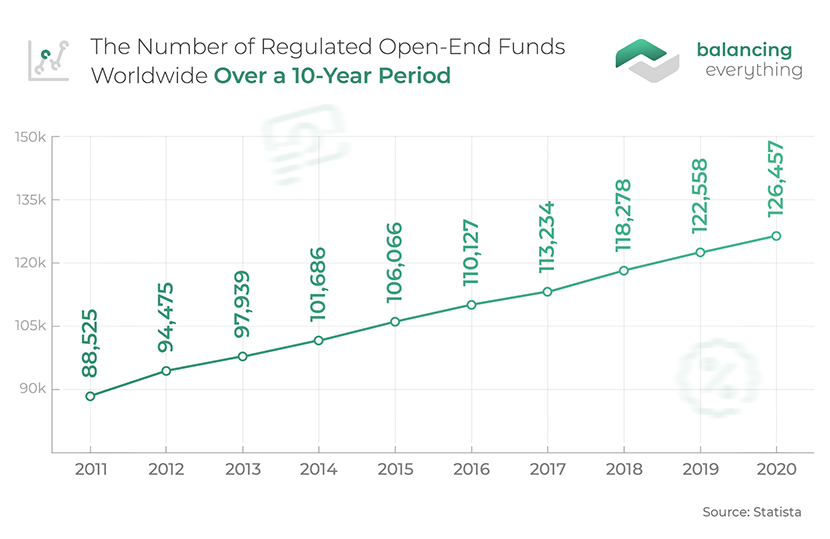
2. The total number of regulated open funds worldwide grew at a CAGR of around 4% between 2011 and 2020.
In 2011, there were 88,525 open-ended funds worldwide, and that figure reached 126,457 in 2020. Mutual funds global statistics point to the consistent growth in the popularity of mutual funds and similar investment vehicles, with more investors focusing on the benefits such as the relative safety because of the inherent diversification of the portfolio of shares in a fund.
(Statista)
3. Nearly half of the assets of regulated open funds worldwide in 2020 were concentrated in the US.
The size of the assets under management in the mutual fund market is a sign of the maturity of an economy — the bigger the size, the more developed the economy. It’s no wonder then that the US accounted for 47% of the assets of regulated open funds in 2020. Europe came in second with 35% of the assets, followed by the Asia Pacific at 14%. The rest of the world accounted for 5% of the total assets in open funds in 2020.
(Statista)
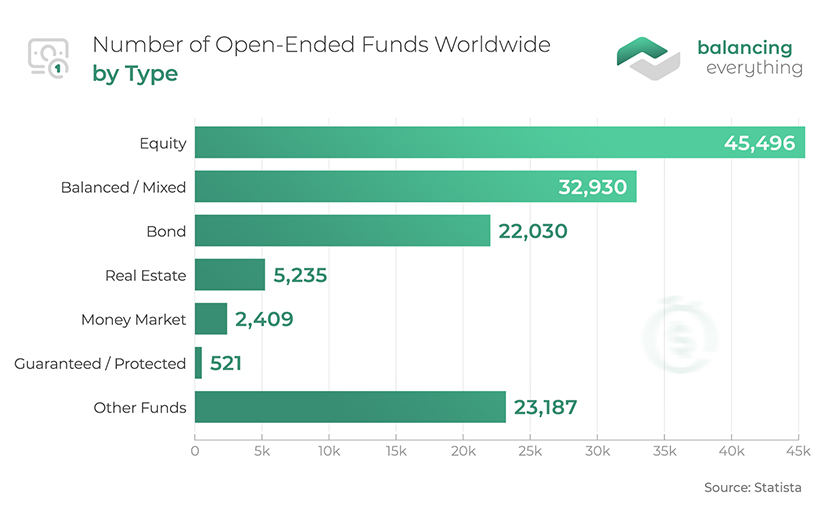
4. Mutual funds assets statistics show that the assets invested in regulated open-end funds worldwide were $56.92 trillion by the end of 2020.
The largest portion of this figure ( $28.3 trillion) was held in inequity funds. Bind and mixed funds accounted for $13.1 trillion and $13.3 trillion, respectively, while money market mutual fund assets stood at $8.3 trillion.
(Statista)
5. How big is the mutual fund industry? The total net assets of US-registered mutual funds in 2020 were $23.9 trillion.
This marks a $5-trillion increase from 2017’s all-time high of $18.76 trillion. Note that these are worldwide assets of US-registered funds that don’t include mutual funds that primarily invest in other mutual funds.
(Statista)
6. How many mutual funds are there in the US? 7,636, according to 2020 figures.
This marks a nearly 4% decrease from 2019. The total number stateside has remained steady for the past few years, following a drop in the wake of the financial crisis — from 8,860 in 2008, to 8,594 in 2009 and 8,523 in 2010.
(Statista)
7. The total net assets of US-registered mutual funds increased by over 200% between 2010 and 2020.
Mutual funds statistics show that 2008 was a bad year for investors, with a low value of total asset allocation at $9.62 trillion after the previous year’s high of $12 trillion. In 2010, as the economy began recovering the value reached $11.83 trillion and increased by over a double a decade later reaching $23.9 trillion.
(Statista)
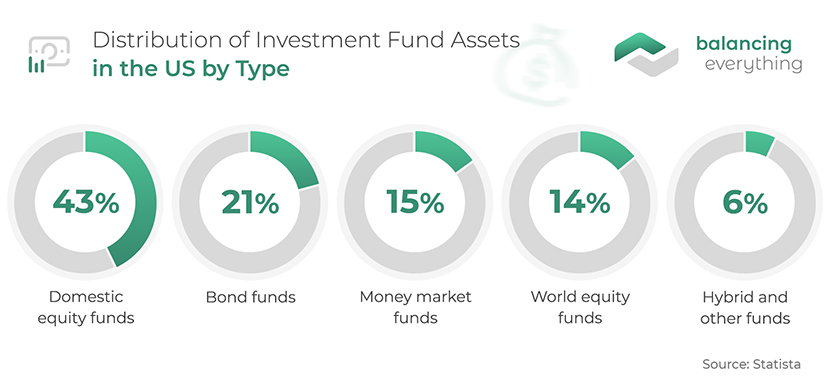
8. 43% of total assets allocated to mutual funds in the US are invested in domestic equity funds.
Based on asset allocation across the total number of mutual funds in the US, of the four main types of mutual funds—equity funds (domestic or international), bond or fixed-income funds, money market funds, and hybrid funds—domestic equity seems to be the most popular, accounting for the highest mutual funds flow by far. They are followed by bond funds with a 21% asset share, world equity funds with 14%, money market funds with 15%, and hybrid funds with a 6% share.
(Statista)
9. The total net assets held by mutual funds in the US are expected to reach $23.73 trillion by 2024.
The stronger US economy has been fuelling the expansion of mutual fund AUM, and the trend is expected to hold in the near future, with AUM projected to reach levels never seen before in the history of mutual funds. However, this does not imply that all is well with the industry. Mutual funds industry statistics indicate that investors are concerned about the high fees charged by managers, unjustified in a tech-powered world, putting pressure on funds.
(Mordor Intelligence)
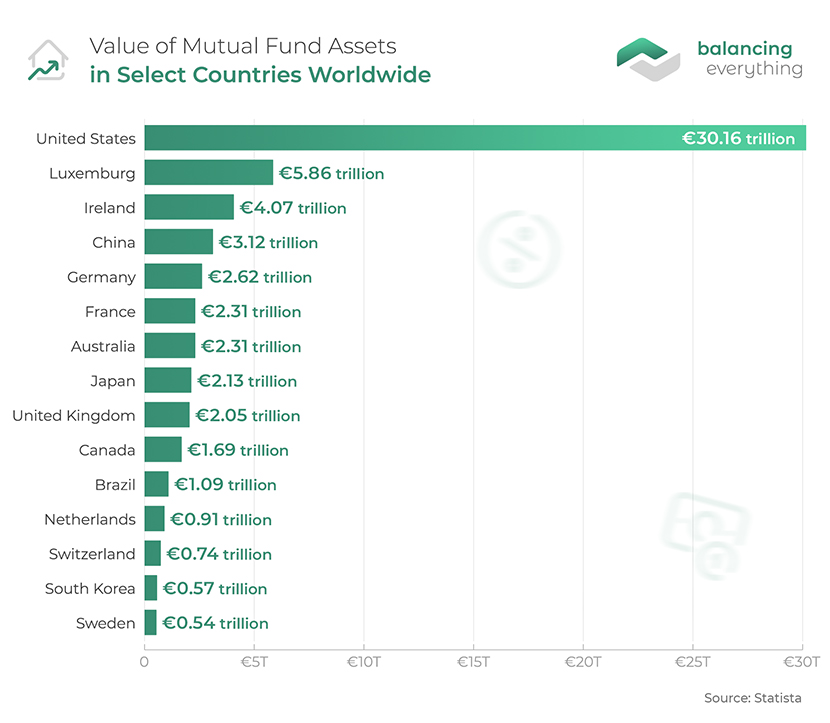
10. Luxembourg is the country with the second-largest mutual fund industry, with mutual funds AUM worth €5.86 trillion.
Luxembourg is the home to several financial entities on account of its tax incentives. This is the reason for its major role in the mutual fund industry, bigger than countries with larger investor bases. Other countries with the largest mutual funds industries include Ireland (€4.07 trillion AUM), China (€3.12 trillion AUM), Germany (€2.62 trillion AUM), France (€2.31 trillion AUM), Australia (€2.31 trillion AUM), Japan (€2.13 trillion AUM), the UK (€2.05 trillion AUM), and Canada (€1.69 trillion AUM).
(Statista)
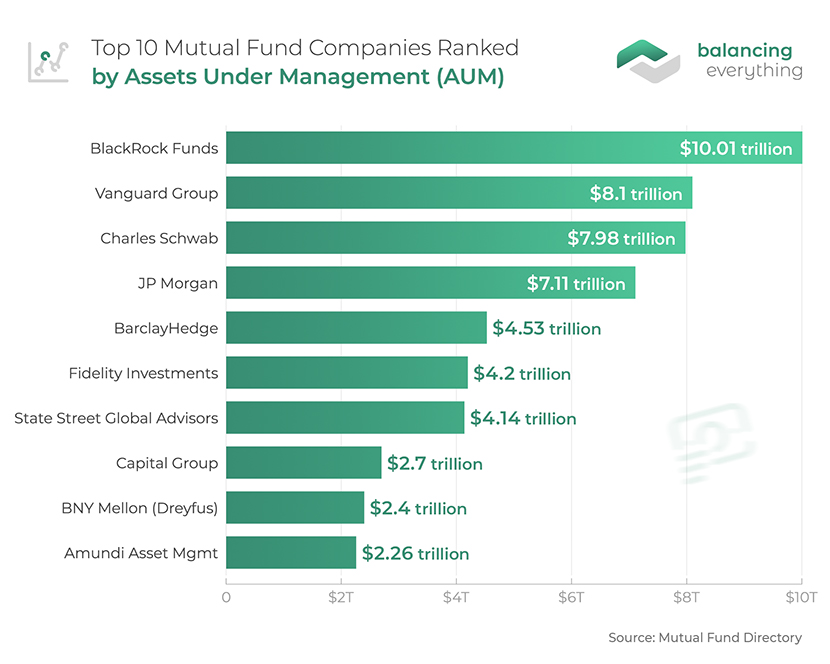
11. At the moment of writing, BlackRock Funds is the largest mutual fund management company in the world with AUM of over $10 trillion.
As of Q1 2022, all except one of the ten top mutual funds companies by assets are from the US. BlackRock Funds is followed by Vanguard Group ($8.1 trillion AUM), Charles Schwab ($7.9 trillion AUM), JP Morgan ($7.1 trillion AUM), and Barclay Hedge ($4.5 trillion AUM). Among the ten largest mutual fund companies, the only non-US is Paris-based Amundi Asset Management, with an AUM of $2.2 trillion. Note that these AUM refer to all assets under management and not only those limited to mutual funds.
(Mutual Fund Directory)
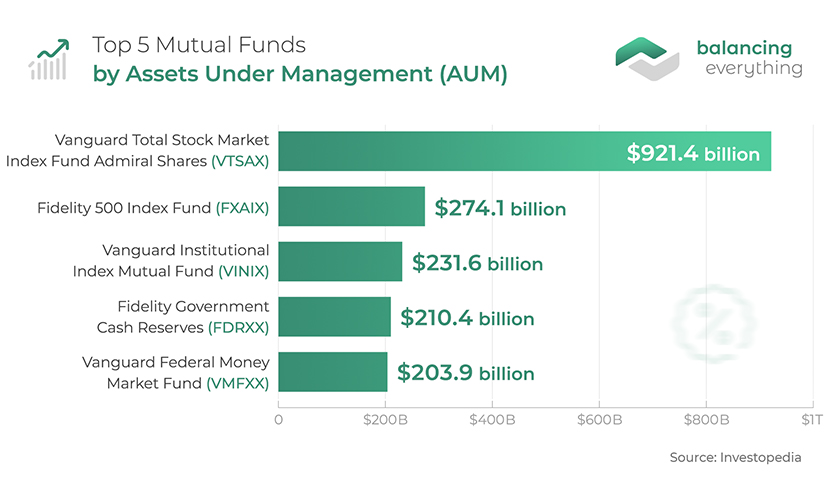
12. The largest mutual fund in the world by AUM is the Vanguard Total Stock Market Index Fund Admiral Shares (VTSAX) with an AUM of $921.4 billion.
As of 2020, the fund’s 3-year annualized performance is 13.21% and has an expense ratio of 0.04%. The fund invests in the entire US equity market: small-, mid-, and large-cap growth and value stocks. The five largest mutual funds by assets under management are:
- Vanguard Total Stock Market Index Fund Admiral Shares (VTSAX) – $921.4 billion;
- Fidelity 500 Index Fund (FXAIX) – $274.1 billion;
- Vanguard Institutional Index Mutual Fund (VINIX) – $231.6 billion;
- Fidelity Government Cash Reserves (FDRXX) – $210.4 billion;
- Vanguard Federal Money Market Fund (VMFXX) – $203.9 billion.
(Investopedia)
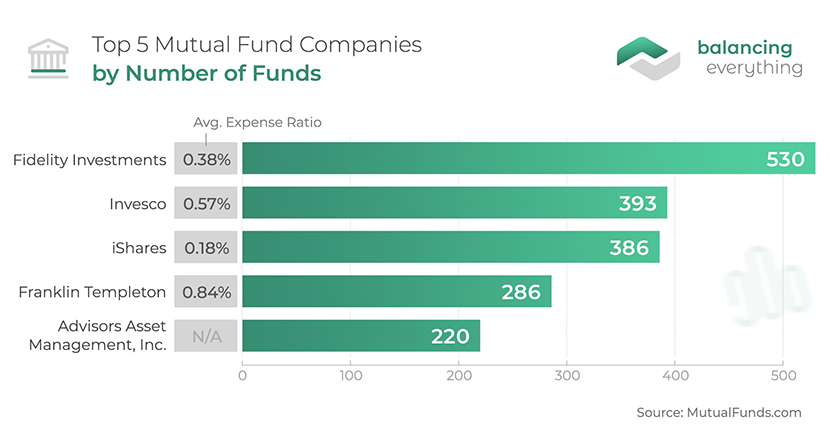
13. At the moment of writing, Fidelity Investments has the highest mutual funds number at 530, with an average expense ratio of 0.38%.
The company’s oldest fund was launched in 1930, making it one of the most experienced industry players. This is followed by Invesco, which has 393 funds on offer, with an average expense ratio of 0.57%. Other names among the largest mutual fund firms providing large numbers of funds are iShares (386 mutual funds and 0.18% average expense ratio), Franklin Templeton (286, 0.84%), and Advisors Asset Management, Inc. (220, with no data on average expense ratio).
(MutualFunds.com)
14. Average expense ratios for actively managed equity mutual funds worldwide fell by 25% between 2010 and 2020.
The corresponding decline for passively managed equity mutual funds has been 60% over the same period. These affect the mutual fund returns to investors. One of the key facts about mutual funds is that high expense ratios are a major cause of concern for investors, who have been forcing these ratios to come down.
(Statista)
15. Combined active and passive fund expense ratios in the US are expected to decline by 22% by 2025.
Buyer demand for lower fees and the growing popularity of low-cost passive products is expected to put further pressure on expense ratios and fund managers’ incomes. Expense ratios have already registered a decline in the last few years, and the mutual fund outlook for the near future shows further squeezing, requiring managers to work harder to maintain profits and stay competitive.
(PwC)
US Mutual Fund Investor Statistics
16. 45.7% of households owned mutual funds in the US in 2020.
The share of American households owning mutual funds has hovered between 43% and 46.3% since 2000. In 1990, 25.1% of US households owned mutual funds. The number climbed to 28.7% in 1995, jumping to 45.7% by 2000.
(Statista)
17. The median mutual funds asset allocation of households was $150k in 2018.
The median number of mutual funds owned by households was 4. Other statistics on the demographics of mutual fund investors in the US show that 70% of individuals heading mutual fund-owning households were married or living with a partner, more than 50% were college graduates, and more than 75% were working full- or part-time.
(Investment Company Institute)
18. The mutual fund ownership in the US in 2021 was the highest among Gen X at 53%..
Comparing the ages of the individuals heading mutual fund-owning households in the US, the highest incidence of 52% was among those born between 1965 and 1980. Mutual fund statistics further show this was followed by 33% mutual fund-investment incidence among Baby Boomers (born between 1946 and 1964), followed by 39.6% for Millennials (born between 1981 and 2004). and 9% for the Silent and GI generations (born between 1904 and 1945).
(Investment Company Institute)
19. Nearly 90% of mutual fund-owning households cite historical performance as a very or somewhat important criterion when choosing mutual funds.
These investors conform to the general advice given by most experts that past long-term performance gives a decent idea of a fund manager’s capabilities. After the average rate of return on mutual funds over time, investors consider fees and expenses the second-most important criterion, with 40% of households deeming it very important and 39% somewhat important. Performance compared with an index is a close third, followed by the rating of a mutual fund.
(ThinkAdvisor)
20. Two-thirds of US investors preferring mutual funds say they expect an annual return between 4% and 6%.
This is surprising considering that even long-term returns on most categories of mutual funds have been above this figure in recent times. At the same time, reasonable mutual funds average return expectations show investor maturity. This could also indicate a poor overall outlook for the economy.
(Brandon Gaille)
21. 22% of investors say the primary reason they avoid mutual funds is high management fees.
The lucrative margins in the industry average about 30%, and they haven’t narrowed in recent times. The high fees charged by fund managers obviously bring down the average mutual fund return for investors vis-à-vis other investment options, discouraging them from placing their hard-earned cash in such vehicles.
(Brandon Gaille)
22. Saving for retirement is the primary financial goal for 73% of mutual fund owners in the US.
Mutual funds serve as an important means for long-term savings for US households. Other primary reasons include saving for emergencies (6%), enhancing current income (6%), saving for education (5%), saving to purchase a house or another large item (5%), reducing taxable income (3%), and others (2%).
(Investment Company Institute)
23. 47% of all mutual funds assets in the US are held in retirement accounts, as per mutual funds statistics.
As of 2021, over $10 trillion of US mutual funds assets — 47% of overall mutual funds assets — were held in retirement accounts such as employer-sponsored DC plans and IRAs, including 401(k) plans. Assets in 401(k) plans stood at $4.8 trillion, or 19% of total mutual fund assets. This underlines the importance of long-term mutual fund investment in the US and the faith shown by Americans in these instruments.
(Investment Company Institute)
Mutual Funds Return Rate Statistics
24. For stock mutual funds, a good long-term return is 8%–10%.
This refers to annualized returns for a period of 10 years or longer. Of course, the true determination of good long-term performance is when the fund can beat a benchmark index for a long period (10 years or more). It is always advisable to review long-term returns when researching mutual funds. Similarly, for bond mutual funds, a good long-term return would be 4%–5%. Again, this is a generalized case and an investor should compare the bond mutual fund with a benchmark.
(The Balance)
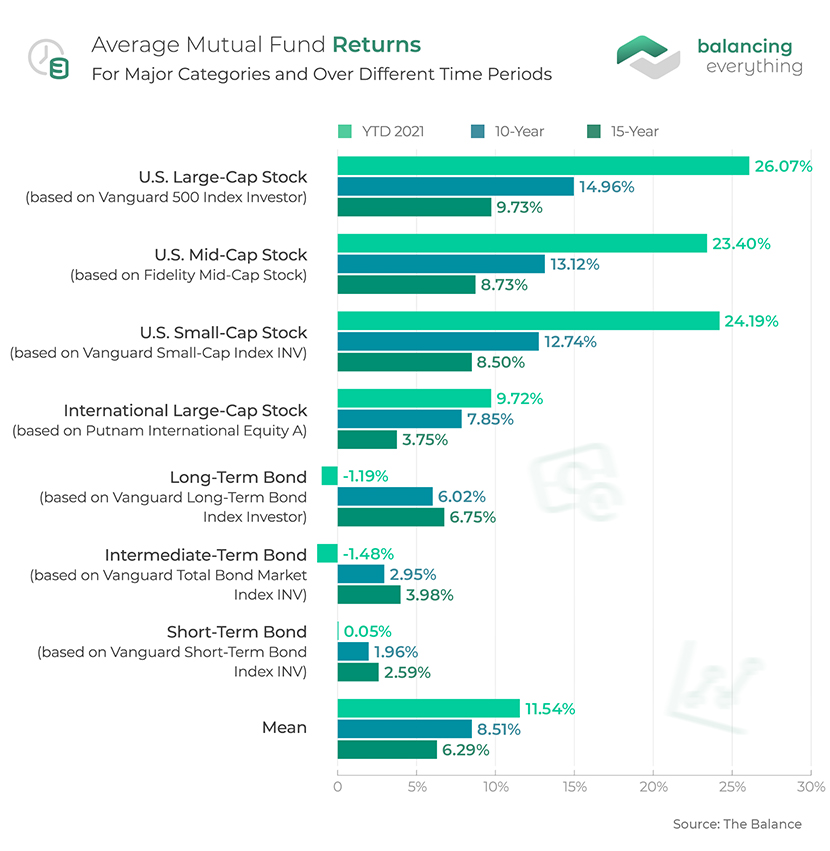
25. In 2021, the average return on mutual funds in seven major categories was about 11.54%.
This was more than double the average annual return of these mutual funds over the past 15 years. This is why looking at only one year’s performance can be misleading when researching mutual funds. It is always better to look at long-term returns to get an idea of how the mutual fund is likely to perform if you invest in it.
(The Balance)
26. US large-cap stock mutual funds had an average 15-year return of 9.73% as of 2021.
The 15-year returns for US mid-cap stock mutual funds, US small-cap stock mutual funds, and international large-cap stock mutual funds were 8.73%, 8.50%, and 3.75%, respectively. The average return on mutual funds for the last 10 years for US large-cap stocks was 14.96%. The corresponding 10-year returns for US mid-cap stock, US small-cap stock, and international large-cap stock mutual funds were 13.12%, 12.74%, and 7.85%, respectively.
(The Balance)
27. Long-term bond mutual funds had an average 15-year return of 6.75% as of 2021.
The 10-year and YTD 2020 returns for long-term bond mutual funds were 6.02% and -1.19%, respectively. The 15-year, 10-year, and YTD 2021 returns for intermediate-term bond mutual funds were 3.98%, 2.95%, and -1.48%, respectively. The corresponding average mutual fund interest rates for short-term bond mutual funds were 2.59%, 1.96%, and 0.05%. Category returns are often considered a better measure of how individual mutual funds in that category are likely to perform because these returns factor in expense ratios.
(The Balance)
28. At 11.54% average annualized returns, mutual funds outperform other major types of investments as of 2021.
The average interest rate for a 5-year certificate of deposit has been under 2% from August 2010 through the end of 2021, performing well below the typical return on mutual funds. 10-year treasuries have had an annualized return of 7.06% over the same period, gold has averaged 3.14%, and the 10-year annualized return on real estate investments has been 7.06%. Mutual funds have also consistently outpaced inflation over the long term.
(The Balance)
29. As of March 2020, the best performing US large-cap growth fund was Pax Large Cap Fund Individual Investor with a YTD return of 6.21%.
The 5-year average return for the fund was 15.45%. The other funds in the top 5, along with their respective YTD and 5-year average mutual fund returns were PGIM Jennison Focused Growth Fund – Class Z (5.78%, 16.52%), DWS Capital Growth Fund – Class S (5.53%, 15.06%), PGIM Jennison Growth Fund – Class Z (5.50%, 15.88%), and Fidelity Blue Chip Growth Fund (5.17%, 15.88%). All these are actively managed mutual funds that buy stocks in rising US companies with a market cap of more than $10 billion. Note that the ranking would be different if comparing longer-period average returns.
(Nerdwallet)
Mutual Fund Facts
30. Hybrid mutual funds have the highest asset-weighted average expense ratios at 0.78%.
Expense ratios are the ongoing costs associated with a mutual fund, which include components like portfolio management, fund administration, daily fund accounting and pricing, and shareholder services. The corresponding figures for equity funds, bond funds, and index funds, as of December 2019, are 0.70%, 0.57%, and 0.11%. Higher priced mutual funds can have expense ratios above 1% also, which impacts the mutual fund return rate. Note that there might be differences in averages based on sector, geography, market cap, and other subcategories.
(DoughRoller)
31. Mutual fund fees can reduce your returns anywhere from 0.5% to 8.5%.
Mutual fund fees can be a sneaky thing, and investors need to watch out for any potential hidden fees before putting their money into a fund. For instance, front-load fees are deducted right at the beginning, but there are back-load fees that get deducted if you withdraw your investment within the first five years. There are, of course, management expense fees, and 12b-1 fees which can affect your average ROI on mutual funds.
(The Balance)
32. Two-thirds of all actively-managed funds do worse than their benchmark indexes.
This is why it’s better to look at the long-term performance of funds. More specifically, it’s important to compare the mutual fund’s performance with the correct benchmark index.
(The Balance)
33. Mutual funds typically maintain a cash ratio of 3% to 5%.
Mutual funds cash ratio or liquidity ratio is the amount of cash in a fund relative to its total assets. Mutual funds statistics show that investors can track the industry liquidity to get a sense of the fund managers’ collective perception of the market. If the cash ratio is above 5%, it means the funds are keeping more cash liquid instead of investing it, indicating a bearish outlook. Levels below 5%, therefore, indicate a bullish outlook.
(Investopedia)
34. 99% of funds that have outperformed the market in one decade fall to the average the following decade.
Mutual funds performance statistics show that while it is advisable to use past performance for mutual funds analysis, it’s also vital to know that good past performance does not guarantee excellent performance in the future. In essence, there is no risk-free method to choose consistent winners in mutual funds.
(The Balance)
Mutual Fund FAQs
How many mutual funds are there in the world?
There is no standard agency that provides a count of all mutual funds worldwide. However, the Investment Company Institute gives a number of regulated open-ended funds, which include mutual funds. This figure for 2019, the last year for which data is available, is 122,528. In the US, there were 9,599 mutual funds in 2018, but the number came down to 7,945 in 2019.
How much money is in mutual funds?
The total assets under management for US-registered mutual funds amount to $21.29 trillion. Worldwide, total assets under management in under-regulated open-ended funds are $54.88 trillion.
How do mutual funds measure performance?
Mutual funds measure performance by benchmarking against a relevant index. For example, a US-based large-cap equity mutual fund will benchmark itself against the S&P 500.
What is a mutual fund company?
A mutual fund company, also commonly known as an asset management company, is a team of professionals that pools investments from various parties and puts them into different securities. When you invest in a mutual fund company, you invest in the portfolio they offer.
Mutual fund companies are what kind of companies?
Mutual fund companies can operate as SEC-registered corporations or trusts in the US. They are overseen by a board of directors in the former case and by a board of trustees in the latter that ensures that the fund is managed in the interests of its investors.
Should I invest in mutual funds?
Any investment depends on your financial resources, risk appetite, and return expectations. As with any type of investment, before deciding for or against putting your money in mutual funds, research the risks and returns involved in different categories of mutual funds.
How to invest in mutual funds in the USA?
If you are a 401(k) investor, you have access to a range of funds selected by your employer. If you are investing outside your employer-sponsored plan, there are three main options to invest in mutual funds in the USA:
- Directly through the fund companies such as Vanguard and Fidelity.
- Using a ‘supermarket’ that offers options from different providers. An online brokerage that houses your IRA or regular brokerage account will offer fund supermarkets. Many fund companies also allow you to set up a brokerage account.
- Through a broker or a financial planner.
What is the average rate of return on mutual funds?
According to The Balance, two-thirds of mutual fund investors target an annual return between 4% and 6%. According to Morningstar, US large-cap stock mutual funds had an average 15-year return of 8.66% as of 2020, while long-term bond mutual funds had an average 15-year return of 5.27%.
Should I put all my money in one mutual fund?
No, you should diversify your investment across multiple mutual funds, which can provide you safety if one set of stocks performs poorly. However, diversification beyond a certain point becomes useless because you would be holding the same stocks across multiple funds, and it will become unwieldy.
How many mutual funds should I hold?
The ideal number advised by experts is 3 or 4. It also depends on the amount you are investing — for a small amount every month, even 2 might be enough.
Can I lose money in a mutual fund?
Yes, you can. Mutual funds are made up of securities that have risks associated with them. Since these underlying securities can increase or decrease in value over time, the returns can also be positive or negative over a certain period.
How long should I invest in a mutual fund?
While many experts would advise you to invest in a mutual fund from a long-term perspective, i.e., at least 5 to 7 years, if not more, this depends on your requirements. If you are planning for retirement, consider equity or balanced funds. For shorter-term goals like higher education or a major purchase, there are options such as less than one year (liquid or ultra-short-term funds), one to three years (short-term debt funds), and three to five years (income funds or dynamic bond funds). Mutual funds facts show that the returns in long-term funds are higher on average compared to short-term funds.
What are the common measures of risk for mutual funds?
Common measures of risk for mutual funds include:
- Alpha – the excess return of the mutual fund relative to the return of the benchmark index and measures the investment’s performance on a risk-adjusted basis.
- Beta – Calculated using regression analysis, it is a measure of a fund’s movement compared to the overall market.
- R-squared – It is a statistical measure that represents the percentage of a fund portfolio’s movements that can be explained by movement in the benchmark index.
- Standard Deviation – It is a measure of how much the mutual fund return rate deviates from the expected returns based on the fund’s historical performance.
- Sharpe Ratio – It tells investors if the fund’s returns are due to wise investment decisions or to excess risk. It is calculated by subtracting the risk-free rate of return from the fund’s rate of return and dividing the result by the fund’s standard deviation.
Conclusion
Mutual funds remain an important means for the average investor to participate in financial markets. Given their many advantages, including the range of options available to suit different risk appetites, anyone interested in making their money grow should be aware of these investment vehicles. That said, as these mutual funds statistics show, these tools do not guarantee high or even positive returns, requiring caution even from even seasoned investors.
References: Statista, Statista, MutualFundDirrectory, Investopedia, Statista, ICI, Statista, Statista, Statista, Statista, Statista, Statista, Mordor Intelligence, MutualFunds.com, Statista, PwC, Statista, Investment Company Institute, Investment Company Institute, ThinkAdvisor, Brandon Gaille, The Balance, The Balance, Nerdwallet, DoughRoller, The Balance, Investopedia


Leave a Reply